
The ELA system has shown that men are still more likely than women to find a job (hired employment or self-employment) after graduation. The source of these differences can be sought among graduates of technical universities and colleges (the differences disappear if we eliminate technology and engineering from the list). The highest percentage of women in technology and engineering can be found among biotechnology graduates (79%) and architecture and urban planning graduates (73%), whereas the lowest percentage can be found among automation, robotics and electronics graduates (5%).
Does this mean that there is discrimination against women in technical occupations? Not necessarily. It turns out that technology and engineering disciplines are highly varied in terms of popularity among women and the labour market performance of graduates.
In the technical sciences, the proportion of women employed is higher than that of men only in transport (75% of women, 73% of men, 33% of graduates are women). Geodesy and cartography, on the other hand, have equal percentages of those employed: 62% for each sex. However, as many as 55% of graduates here are women.
In the case of women-dominated areas, the level of employability is generally lower (percentage of months worked under a contract of employment or under self-employment) among both men and women. For men-dominated fields, the share of graduates in employment is highest of all.
|
Quarter after graduation |
Percentage of those employed (hired employment or self-employment) |
|||
|---|---|---|---|---|
|
Total graduates |
After exclusion of technical sciences |
|||
|
Men |
Women |
Men |
Women |
|
|
Q1 |
59% |
54% |
54% |
54% |
|
Q2 |
67% |
62% |
62% |
62% |
|
Q3 |
71% |
67% |
67% |
67% |
|
Q4 |
74% |
69% |
70% |
69% |
|
Q5 |
77% |
73% |
73% |
73% |
|
Q6 |
78% |
75% |
74% |
75% |
|
Q7 |
80% |
77% |
77% |
77% |
|
Q8 |
81% |
78% |
78% |
78% |
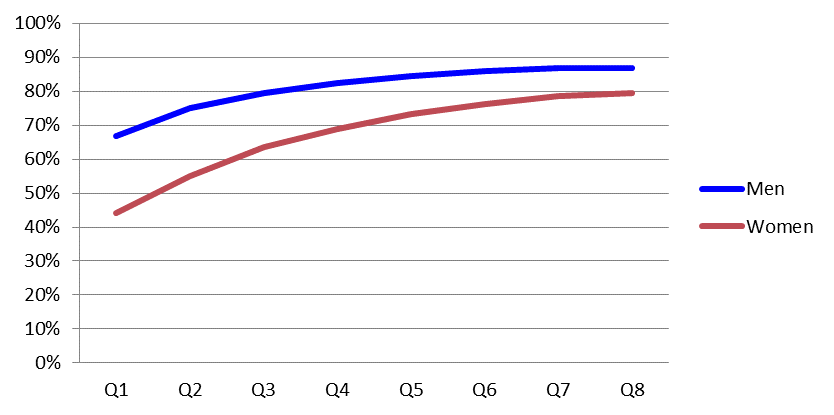
Table 2. Employability rate (percentage of months worked in hired employment or self-employment) among women and men, by field of study
|
Field |
Percentage of women in employment |
Percentage of men in employment |
Percentage of women among graduates |
|---|---|---|---|
|
Automation and Robotics |
68% |
80% |
5% |
|
Electrical Engineering |
78% |
86% |
5% |
|
Electronics |
68% |
81% |
11% |
|
Computer Science |
76% |
82% |
11% |
|
Mechanical Engineering |
57% |
78% |
16% |
|
Construction and Operation of Machinery |
72% |
80% |
20% |
|
Energy Engineering |
67% |
71% |
21% |
|
Mining and Geology Engineering |
64% |
84% |
22% |
|
Construction |
72% |
78% |
31% |
|
Transport |
75% |
73% |
33% |
|
Materials Engineering |
59% |
67% |
49% |
|
Production Engineering |
70% |
80% |
52% |
|
Environmental Engineering |
62% |
77% |
53% |
|
Geodesy and Cartography |
62% |
62% |
55% |
|
Chemical Technology |
59% |
64% |
71% |
|
Architecture and Urban Planning |
48% |
50% |
73% |
|
Biotechnology |
50% |
50% |
79% |