
ELA 6: many more new functionalities
Until recently, the Polish Graduate Tracking System (ELA) presented information on the careers of each cohort of graduates individually. When the sixth edition of ELA was launched, experts at the National Information Processing Institute (OPI PIB) added a tool that allows users to compare the circumstances of graduates from different cohorts at the same stage of their professional lives easily and quickly. The new functionality was made available to all users on 6 July 2021.
ELA: one of the top systems in the European Union
ELA presents information on the professional circumstances of graduates for the first five years of their post-university careers. In 2020, for the first time in history, users could view the full five-year monitoring period for the 2015 cohort. In 2021, the same was possible for those who graduated in 2014. This means that the circumstances of graduates representing different cohorts can now be compared throughout their five-year monitoring periods.
The information on graduates' careers was previously presented in a way that showed the positions of individual cohorts on the labour market in consecutive years following graduation. Adding the ability to compare individual cohorts serves two purposes. The first is to identify tendencies in how consecutive cohorts engage in the job market – including, for example, determining the changes in their circumstances at the moment they entered the workforce. The second purpose is to better illustrate the position of the ‘average’ graduate on the job market. The accomplishments of consecutive cohorts might be subject to sporadic changes that can be attributed to specific features of that group, or to periodic changes in the economy.
A new type of report
In response to the needs of the job market and of the higher education sector, ELA is now able to present a new type of report that can focus on individual fields of study, selected higher education institutions, or national figures. The reports compare the careers of different cohorts over the same periods with the use of two rates: the relative unemployment rate oraz relative earnings rate. These allow users to compare the absolute values of unemployment risk and earnings of the groups monitored with wider circumstances in the powiats in which they reside1.
The interpretation of both rates is uncomplicated:
- A relative unemployment rate below 1 indicates that the average risk of unemployment for graduates was lower than the unemployment rate in the powiats they resided during the monitoring period; in other words, the lower the value, the better.
- An relative earnings rate above 1 indicates that, on average, graduates’ earnings were higher than the average in the powiats they resided during the monitoring period; in other words, the higher value, the better.
Below are the results of national comparisons, presented separately for first-cycle, second-cycle, and long-cycle master's programme graduates.
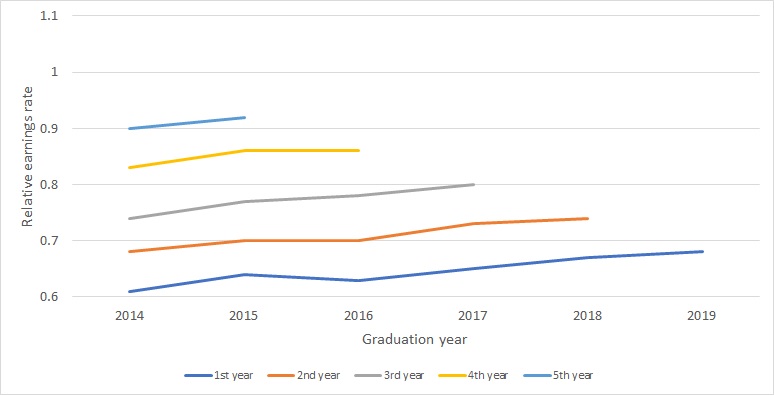 Figure 1. Comparison of the relative earnings rates of 2014-2019 first-cycle graduates in consecutive years following graduation (source: ELA data).
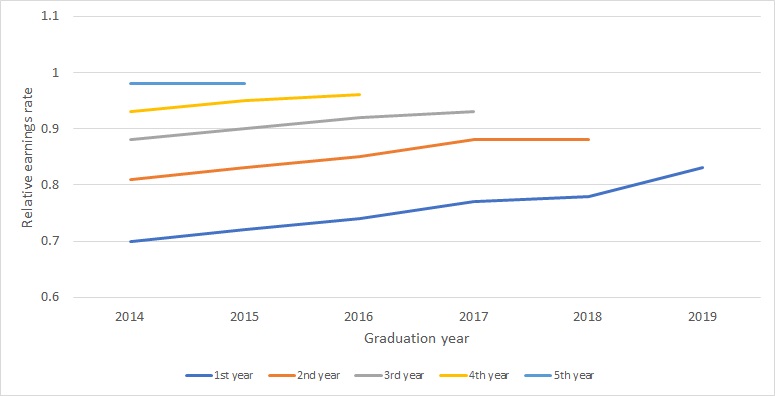 Figure 2. Comparison of the relative earnings rates of 2014-2019 second-cycle graduates in consecutive years following graduation (source: ELA data).
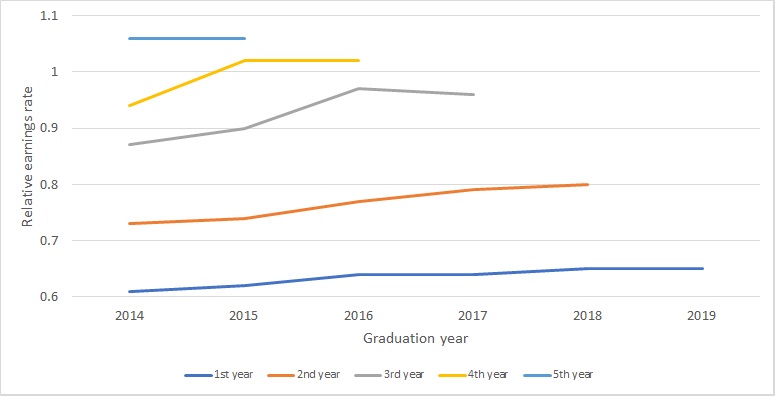 Figure 3. Comparison of the relative earnings rates of 2014-2019 full-cycle master's degree graduates in consecutive years following graduation (source: ELA data).
Studying pays off: graduates' earnings are increasing
In all three groups, two similarities can be observed: first, across all cohorts, graduates' earnings in consecutive years following graduation are growing faster than average in their places of residence; and second, each year after graduation is characterised by particularly relative earnings rates across the monitoring period, which are highly similar between cohorts. The average graduate of a long-cycle master's programme earns between 60 and 65% of the average local remuneration in his/her first year after graduation, between 70 and 80% in the second year, and 106% after five years (see Figure 3). The upward trend in the relative earnings rate for consecutive cohorts can be explained partially by the increasing share of graduates who gain work experience during their studies. According to previous ELA system analyses, such graduates generally earn more than others.
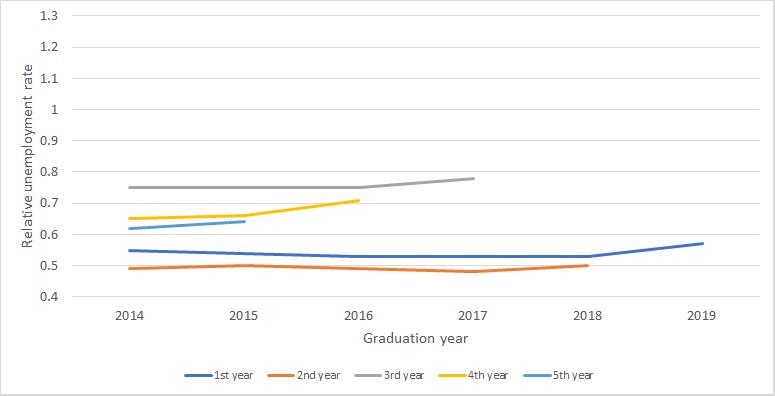 Figure 4. Comparison of the relative unemployment rates of 2014-2019 first-cycle graduates in consecutive years following graduation (source: ELA data).
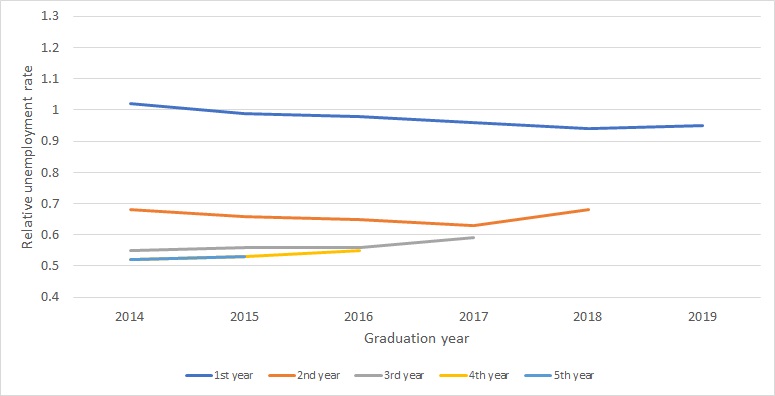 Figure 5. Comparison of the relative unemployment rates of 2014-2019 second-cycle graduates in consecutive years following graduation (source: ELA data).
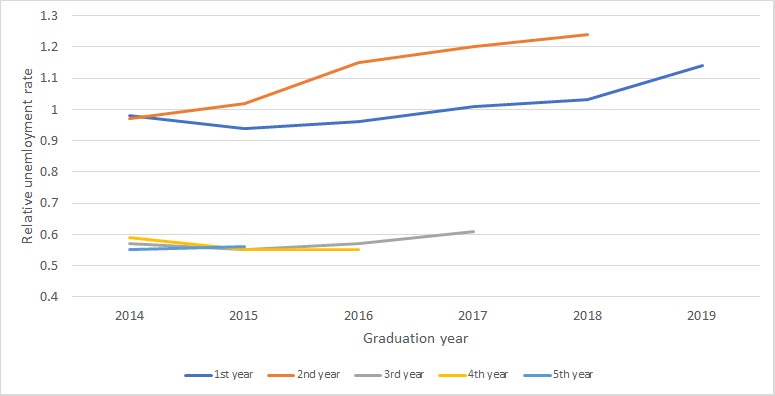 Figure 6. Comparison of the relative unemployment rates of 2014-2019 full-cycle master's degree graduates in consecutive years following graduation (source: ELA data).
Analysis of the relative unemployment rate leads to three conclusions.
First, Figures 4–6 present the consequences of the specificity of each study cycle. The most visible similarities can be observed in the case of second-cycle graduates (Figure 5), for which the unemployment rate in consecutive years following graduation decreases. Figure 4, which depicts the relative unemployment rates of first-cycle graduates, paints a different picture: the rate of unemployment in the first and second years following graduation is significantly higher than in the following years. This is because over two-thirds of first-cycle graduates continue their education by enrolling in second-cycle programmes, and subsequently, do not register as unemployed. The higher relative unemployment rates in later years following graduation are due to students completing their studies and entering the job market. It should be noted, however, that the relative unemployment rates for the third, fourth, and fifth years after graduation progressively reduces. The experiences of long-cycle graduates are entirely different: the higher rate of unemployment in the second year following graduation is due to graduates registering as short-term unemployed en masse; this is common among medical doctors who have recently completed their internships. This usually occurs during the second year after graduation in medical sciences. The relative unemployment rates from the third year following graduation onwards are significantly lower and more stable.
Second, in general, the relative unemployment rates for each cohort differ slightly in respective periods. In the case of first-cycle graduates, the typical value ranges between 0.53 and 0.57 during the first year following graduation, between 0.48 and 0.5 during the second year, and between 0.75 and 0.78 during the third year.
Third, the results in Figures 4–6 show how ELA helps detect anomalies in graduates' circumstances on the job market. The rightmost sections of the lines clearly depict upward trends. It must be noted, however, that they present the conditions that existed in 2020, when the Polish labour market faced significant challenges due to the COVID-19 pandemic; this also affected university graduates, and translated into a higher unemployment rate among that group.
1 The relative unemployment rate is the average value of the ratio of the risk of unemployment among graduates to the rate of unemployment in the powiats they reside. The relative earnings rate is the average value of the ratio of the average monthly remuneration of graduates to the average monthly remuneration in the powiats they reside.